Your Guide to Profit and Loss Statement Templates
A profit and loss statement template is one of the most vital tools in your business toolkit. It neatly summarises your revenues, costs, and expenses over a set period. Think of it as a financial report card for your NZ business, showing you precisely whether you turned a profit or made a loss during a month, quarter, or year. It's the simplest way to understand your financial performance in a single glance.
Why a P&L Statement Is Your Business's Financial Compass

Before we jump into the nuts and bolts of templates and spreadsheets, it’s worth taking a moment to appreciate why the Profit and Loss (P&L) statement is so much more than a bookkeeping chore. For any Kiwi entrepreneur, this document is a strategic guide, providing a clear, honest snapshot of your performance. It tells you exactly where your money came from (revenue) and where it all went (expenses).
Without this insight, you're essentially flying blind, forced to make critical decisions based on gut feelings instead of hard data. A well-kept P&L statement gives you the clarity to steer your business towards real, sustainable growth.
Making Smarter Business Decisions
Your P&L isn't just a look in the rearview mirror; it's a powerful crystal ball for future planning. By digging into the numbers, you can start to identify trends, pinpoint inefficiencies, and make informed choices that have a direct impact on your bottom line.
Here’s how it works in the real world:
Pricing Strategy: Is your gross profit margin looking a bit thin? That's a sign your pricing might be too low, or perhaps your cost of goods sold is creeping up.
Cost Management: Have you noticed your operating expenses getting higher each month? A P&L will highlight exactly which costs are ballooning, so you can investigate and get them under control.
Growth Opportunities: The statement can clearly show which of your products or services are the most profitable, telling you exactly where to focus your sales and marketing efforts.
This kind of financial scrutiny isn't just for big corporations; it’s a universal principle. Even at a national level, tracking revenue against expenditure is critical. In the 2023/24 financial year, New Zealand’s Core Crown tax revenue was $120.6 billion, while its expenses hit $139.0 billion. This shows how crucial an accurate P&L is for budgeting and forecasting, whether you're running the country or a local cafe. You can learn more about these national financial figures and what they mean for the wider economy.
A P&L statement transforms abstract numbers into a compelling story about your business's health. It tells you what’s working, what isn’t, and where you need to adjust course to achieve your goals.
Proving Financial Health to Others
Beyond just helping you run your business, the P&L is a non-negotiable document for anyone on the outside looking in. Whether you're applying for a business loan, pitching to potential investors, or just getting your annual tax returns sorted, you’ll need this report.
It’s the concrete evidence of your business's viability and your competence as a manager. A solid history of profitability, laid out in clear and organised P&L statements, can dramatically improve your chances of securing funding and building trust with financial partners. It proves you have a firm grip on your operations and a clear vision for the future.
Understanding The Anatomy Of Your P&L Statement
Your Profit and Loss statement isn’t just a spreadsheet—it’s the narrative of every dollar your business has earned and spent over a chosen timeframe. Each line item plays a distinct role in that story, guiding you from top-line sales to the final net profit figure. Knowing what belongs where unlocks insights that go far beyond simple bookkeeping.
The Starting Point: Revenue
Sitting at the very top, Revenue captures all income from your core activities before any costs are taken out. Call it your “opening act,” because it sets the scene for everything that follows.
A Wellington café might list takings from flat whites, scones and cabinet food.
A Christchurch plumber would record plumbing jobs, installation fees and call-out charges.
Splitting revenue into multiple streams—like wholesale versus retail, or local versus online—lets you pinpoint which areas drive the most growth.
Calculating Your Gross Profit
Your next move? Deduct Cost of Goods Sold (COGS) from your Revenue. COGS covers only the direct expenses tied to producing goods or delivering services.
For product businesses: raw materials, direct labour and packaging.
For service outfits: wages of staff who deliver the service, such as an account manager at your local marketing agency.
What remains is your Gross Profit, showing how efficiently you turn sales into surplus cash.
Tip: A healthy gross profit margin gives you confidence to cover overheads and invest in new opportunities.
Unpacking Operating Expenses
Gross profit is where the fun really begins—next you account for Operating Expenses (OpEx). These are essential costs that keep the engine running but aren’t directly linked to a single sale.
Common categories include:
Sales & Marketing: Ad spend, digital campaigns, sales commissions.
General & Administrative: Rent, utilities, insurance, Xero subscription fees.
Research & Development: Prototyping costs, software licences for product innovation.
Breaking these into sub-categories helps you spot overspending and reallocate funds to areas that fuel growth.
The All-Important Bottom Line
Subtract total OpEx from your Gross Profit to arrive at Operating Income—your profit from day-to-day operations. Then factor in any non-operating items, such as interest payments and income tax, to reveal the ultimate figure: Net Profit.
This “bottom line” is what you can reinvest, distribute as drawings or use to pay down debt. Mastering each step in this flow empowers you to read any P&L with clarity and make data-driven decisions that steer your business forward.
Building Your Own Profit and Loss Statement Template
https://www.youtube.com/embed/dgHjAHIBvsI
While downloadable templates are a decent starting point, the real magic happens when you build a custom profit and loss statement that actually reflects how your business operates. Creating your own in Excel or Google Sheets gives you total control, ensuring every line item makes sense and you understand exactly how the numbers add up.
This isn't just an accounting exercise. It’s about turning a static report into a dynamic tool that helps you make smarter decisions. A well-designed, personalised template will save you hours down the track and dramatically cut down on manual errors, giving you real confidence in the numbers steering your business.
Setting Up Your Template Structure
First things first, let's lay down the basic framework. Your columns will track time, and your rows will detail all your financial categories. Getting this initial setup right is crucial because it’s the foundation for spotting trends later on.
A smart way to do this is to set up columns for each month, with automated summaries for each quarter and the full year. This gives you both a close-up view and a big-picture perspective.
Monthly Columns: Create 12 columns, one for each month (January, February, etc.). This is where you'll plug in your raw data.
Quarterly Summaries: After every three months, add a column for "Q1," "Q2," and so on. A simple SUM formula here will automatically total the three preceding months for you.
Annual Total: Over on the far right, an "Annual Total" or "YTD" column should sum all 12 monthly columns, giving you the complete financial story for the year.
This layered structure means you can easily drill down into one month's performance or zoom out to see seasonal patterns without having to build a whole new report.
Organising Your Financial Categories
With the columns sorted, it's time to build out the rows. This is where you'll list your income sources, the cost of goods sold (COGS), and all your various expenses. The goal is to create a logical flow that starts with your total revenue and works its way down to your net profit.
Begin with your main revenue streams at the top. If you run a café, for instance, you’d probably want to separate "Beverage Sales" from "Food Sales." This kind of detail immediately shows you which parts of the business are pulling their weight. Right after revenue, list your COGS so you can calculate your Gross Profit.
Below that, you’ll detail your Operating Expenses. Don't just throw them all into one bucket. Group them into meaningful sub-categories to see exactly where your money is going:
Sales & Marketing: This could include advertising spend, social media tools, or sales commissions.
General & Administrative: Think rent, utilities, insurance, and fees for your accounting software.
Salaries & Wages: It's often useful to differentiate between admin staff and any team members whose wages are part of COGS.
This visual shows the simple data flow within your P&L template.
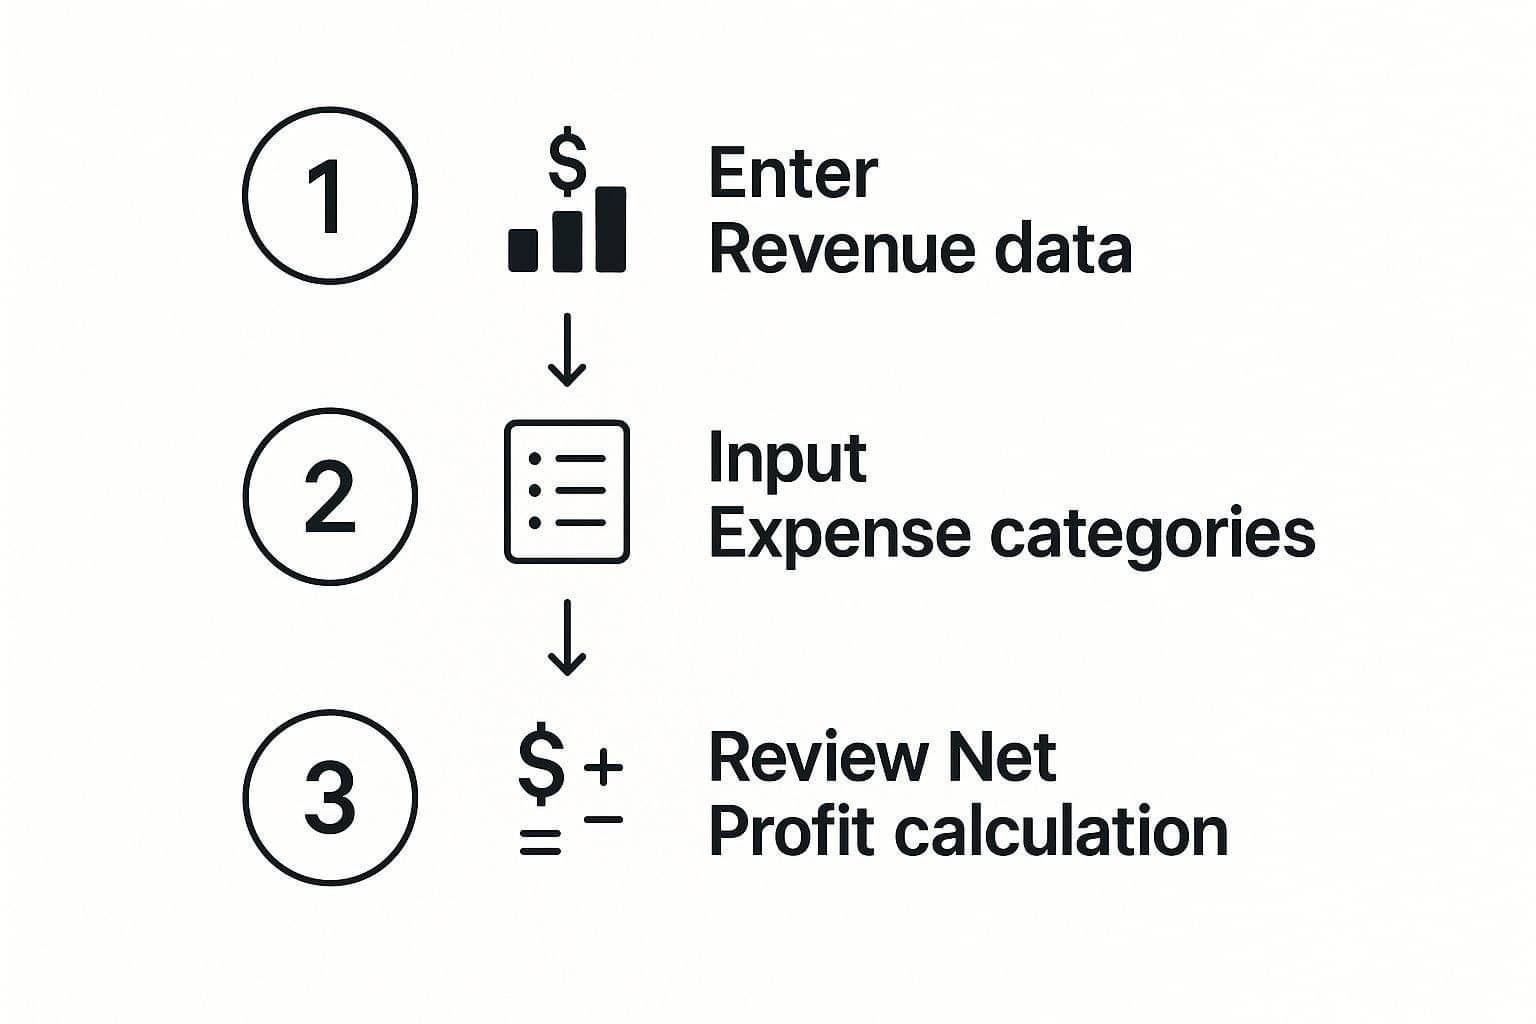
It’s a clear reminder of how each section builds on the last, leading you straight to that all-important net profit figure.
Putting Key Formulas to Work
This is where your template really starts to shine. By adding a few key formulas, you automate all the important calculations. Every time you enter new data, the sheet updates instantly, saving you from tedious manual maths and minimising the risk of a costly typo.
Here are the essential formulas you'll need:
Gross Profit: This is your first major subtotal. In the Gross Profit row, the formula is simply =(Total Revenue) - (Total COGS).
Total Operating Expenses: Use a SUM formula to automatically add up all the individual expense lines in that section.
Operating Income: This tells you how profitable your core business activities are. The formula is =(Gross Profit) - (Total Operating Expenses).
Net Profit: The bottom line. This is calculated as =(Operating Income) - (Taxes) - (Interest).
When you automate these calculations, your P&L becomes a "living" document. As soon as you punch in your monthly numbers, you get immediate feedback on your financial health.
Of course, if you're using dedicated accounting software, this work is largely done for you. Modern tools like Xero can generate these reports automatically, pulling data directly from your bank feeds and invoices.
Still, building a solid template yourself is one of the best ways to truly understand how these powerful systems work and what the numbers really mean for your business. To see how this all comes together in a professional system, check out our ultimate guide to cloud-based accounting software.
Turning P&L Data Into Actionable Business Insights
A finished profit and loss statement is more than just a list of numbers—it’s a treasure map. The real magic happens not when you fill it out, but when you use it to find hidden opportunities, flag potential risks, and build a solid strategy for growth. This is where your financial data stops being a chore and becomes your sharpest competitive edge.
When you start analysing the numbers, you can finally move past guesswork. You’ll be making decisions based on cold, hard facts, which is the difference between hoping your business succeeds and actively steering it towards profitability.
Unlocking Insights With Financial Ratios
A great starting point for analysing your P&L is to calculate a few key financial ratios. Think of these simple formulas as a quick health check for your business. They turn raw numbers into meaningful percentages that are easy to track over time and compare against others in your industry.
It’s a bit like checking the vitals on your car. You don’t just look at the total kilometres; you check the fuel efficiency and oil levels to see how it’s really running. Financial ratios do the exact same thing for your business.
Let’s dig into a couple of the most important ratios you can pull straight from your profit and loss statement template.
Gross Profit Margin: You get this by dividing your Gross Profit by your Total Revenue. It tells you exactly how much profit you’re making from each dollar of sales before you even touch your operating expenses. A low or shrinking margin is a major red flag that your cost of goods is too high or your pricing is too low.
Operating Profit Margin: This one is found by dividing your Operating Income by your Total Revenue. It cuts to the chase, showing how efficiently your core business operations are actually generating profit. It’s a true measure of your ability to turn revenue into real profit after all the day-to-day costs are paid.
These metrics are the pulse of your business. Keep an eye on them every month, and you’ll catch small issues before they snowball into big problems.
To give you a clearer picture, here are some of the most essential ratios you should be tracking.
Essential P&L Ratios for Business Analysis
Financial Ratio | Formula | What It Measures |
|---|---|---|
Gross Profit Margin | (Gross Profit / Total Revenue) x 100 | The profitability of your core products or services, before overheads. |
Operating Profit Margin | (Operating Income / Total Revenue) x 100 | The efficiency of your primary business operations. |
Net Profit Margin | (Net Profit / Total Revenue) x 100 | The overall profitability of your entire business after all expenses. |
Break-Even Point | Fixed Costs / (Sales Price Per Unit - Variable Cost Per Unit | The sales volume needed to cover all your costs without making a profit or loss. |
These ratios aren't just for accountants; they’re practical tools for every business owner. Getting comfortable with them will completely change how you see your financial performance.
Spotting Patterns With Trend Analysis
A single P&L statement is just a snapshot in time. The real story only starts to unfold when you lay several of them out side-by-side. Comparing your P&Ls over consecutive months or quarters—a practice known as trend analysis—is where you’ll start to see patterns and get a feel for what’s coming next.
This comparative view helps you answer some pretty critical questions:
Is your revenue growing steadily, or is it all over the place?
Which expense categories seem to be creeping up month after month?
Are there clear seasonal peaks and troughs in your profitability?
By looking at your financial data over a longer period, you can easily tell the difference between a one-off bad month and a genuinely worrying downward trend that needs your immediate attention. This long-term view is absolutely fundamental for smart strategic planning.
Here’s a real-world example. A Kiwi retail owner in Dunedin might notice their Gross Profit Margin has slipped by 3% over the last six months. By comparing the detailed expense lines in their P&Ls, they quickly spot that shipping costs from one particular supplier have shot up. Armed with that specific data, they can renegotiate terms or find another supplier, directly protecting their bottom line. Without trend analysis, that slow, silent profit leak might have gone completely unnoticed.
From Numbers to Strategy
The insights you find are only useful if you do something with them. The final, most important step is to turn your analysis into a concrete business strategy. This process is the same whether you’re a local Morrinsville tradie or a huge financial institution.
For example, ANZ Bank New Zealand's annual results show a net profit after tax of NZ$1.128 billion, with incredibly detailed income statements that capture every operational detail. This isn't just for compliance; it's a cornerstone of their strategic planning, allowing them to manage expenses with precision and chase controlled growth.
Based on what your P&L tells you, you might decide to:
Adjust Your Pricing: If your margins are looking a bit thin, it could be the perfect time to review and increase your prices.
Cut Unnecessary Costs: Is a particular operating expense ballooning without giving you a clear return? It’s time to find ways to trim it down.
Invest in Growth: If one of your services is way more profitable than the others, maybe it’s time to double down on marketing for that specific offering.
Your profit and loss statement template is just the starting point. When you combine it with the right analysis and modern tools, it becomes an indispensable guide for your business journey. For owners ready to get a better handle on their finances, checking out our top tips for choosing accounting software in NZ is a great next step. It can help you automate this analysis and unlock even deeper insights.
Common P&L Mistakes and How to Avoid Them

An inaccurate Profit and Loss statement can trick you into making some truly disastrous business decisions. It’s like trying to navigate with a broken compass—you think you're on the right track, but you're actually just going in circles.
Spotting these common slip-ups is the key to keeping your financial reports reliable and your business heading in the right direction. The good news is that most of these errors are surprisingly simple to fix once you know what to look for.
Miscategorising Your Expenses
Putting an expense in the wrong bucket is probably the most frequent mistake I see. A classic example is logging a big, one-off software purchase under your recurring monthly "Software Subscriptions" line item. Just like that, you've made your regular operating costs look artificially high for that month, which could send you into a panic thinking your overheads are out of control.
Another classic mix-up is confusing Cost of Goods Sold (COGS) with Operating Expenses (OpEx). It's a critical distinction.
Remember, COGS are the direct costs tied to what you sell. If you're a builder, the timber for a house frame is COGS. The petrol for your ute to get to the site? That's an operating expense. Getting this wrong completely skews your Gross Profit Margin, one of the most important health metrics for your business.
Getting your categories right is absolutely fundamental. An accurate P&L depends on classifying every dollar correctly to reflect the true cost of doing business.
To stop this from happening, set up a clear chart of accounts that spells out exactly what goes where. When you’re unsure, just ask yourself: "Was this cost essential to create the specific product or deliver the service I just sold?" If the answer is no, it’s almost certainly an operating expense.
Forgetting About Non-Cash Items
Not every business cost involves cash physically leaving your bank account. You have to account for non-cash items like depreciation, which is a very real business expense. If you forget to account for the declining value of your assets—like workshop machinery or office computers—you'll end up overstating your profit.
Sure, bigger profit numbers might look good on paper, but they paint a dangerously rosy picture of your financial health. Including depreciation ensures your profit and loss statement template shows the true cost of using your gear to generate revenue.
Viewing the P&L in Isolation
A P&L tells a powerful story about profitability, but it's not the whole story. It's entirely possible for a business to look profitable on paper yet be teetering on the edge of collapse because of poor cash flow. This often happens when you make sales on credit but your customers are dragging their feet on paying their invoices.
Your P&L looks fantastic because it records the revenue as soon as the sale is made (thanks to accrual accounting), but your bank account is empty. To get the complete picture, you must look at your P&L alongside two other crucial reports:
The Balance Sheet: This gives you a snapshot of what you own (assets) and what you owe (liabilities) at a single point in time.
The Cash Flow Statement: This shows how cash is actually moving in and out of your business.
These three documents work together to give you a 360-degree view of where your business truly stands. On top of that, making sure every sale is documented correctly is vital for both your cash flow and your tax obligations. You can get the full rundown in our guide on NZ tax invoice requirements.
Precise financial tracking is also non-negotiable for tax compliance. For instance, the Inland Revenue Department (IRD) reported a record tax take of NZ$115.4 billion for 2023–24, mostly from salary and wage deductions. This really drives home how important an accurate P&L is for tracking your income and getting your tax obligations right. You can discover more about the IRD's latest annual report to see the bigger picture.
Quick Answers to Common P&L Questions
It's one thing to build a profit and loss statement, but it's another thing entirely to really understand what it's telling you. Even after you've got the basics down, a few common questions tend to pop up.
Let's run through some of the most frequent queries I hear from business owners. Getting these sorted will help you read your P&L with more confidence and use it to make smarter decisions.
P&L vs. Balance Sheet: What’s the Difference?
This is probably the number one point of confusion, but there’s a simple analogy to clear it up: think of a video versus a photograph.
Your Profit and Loss statement is the video. It shows your financial performance over a period of time—a month, a quarter, a year. It tells the story of your business activity, showing the revenue you earned and the expenses you incurred to get to your final profit or loss.
On the other hand, a Balance Sheet is a snapshot, a single photograph. It captures your financial position at a single, specific moment. It’s a static picture of what you own (assets), what you owe (liabilities), and what’s left over (equity).
How Often Should I Run a P&L?
For making good, timely decisions, you really can't beat running a P&L statement monthly. This is the gold standard for any small business serious about growth. A monthly check-in lets you spot trends as they emerge, catch rising costs before they spiral, and react quickly to changes in the market.
Waiting until the end of the quarter is like only glancing at your GPS after you've been driving for an hour—you might have already missed your exit. While you'll need to prepare a P&L quarterly and annually for tax and official reporting, a monthly review is essential for actually managing your business day-to-day.
Can I Use the Same P&L Template for Any Type of Business?
At its core, yes. The fundamental structure of a P&L is the same for everyone. Whether you run a dairy farm in the Waikato or a web design agency in Auckland, you'll have revenue, costs, and expenses. The basic formula of Revenue - Expenses = Profit is universal.
The magic, however, is in the customisation. The real value comes from tailoring the specific line items to reflect how your business actually operates.
A retail shop, for instance, will need to detail its Cost of Goods Sold (COGS) for various product lines.
A consultant or other service business will have very little COGS but might want to break down revenue by different service packages or client types.
A manufacturer's COGS will be far more complex, needing line items for raw materials, direct labour, and factory overheads.
The template is just the skeleton. You add the muscle by customising your revenue and expense categories. That’s how a generic document becomes a powerful tool for your specific industry.
If My P&L Shows a Profit, Does That Mean My Cash Flow Is Good?
This is a crucial lesson every business owner needs to learn, sometimes the hard way: profit does not equal cash. It is absolutely possible to have a P&L statement showing a fantastic profit while your bank account is running on fumes.
Why does this happen? Most P&Ls are prepared using accrual accounting. This means revenue is recorded when you earn it (i.e., when you send the invoice), not when the cash actually lands in your account. So, you could have $20,000 in sales on your P&L for the month, but if your clients are slow to pay, you have zero cash to show for it.
Always look at your P&L alongside your Cash Flow Statement. The P&L tells you if you're making money on paper; the Cash Flow Statement tells you if you can actually pay the rent.
At Simplified Office Systems, we help Kiwi business owners move beyond templates to get real clarity over their finances. If you're ready to get your books sorted and turn your financial data into a powerful tool for growth, we're here to help. Visit us at https://www.simplifiedoffice.co.nz to see how we can make your business life a whole lot easier.

Phone 0274 134 782
Email jo@simplifiedoffice.co.nz
126/2 Studholme Street
Morrinsville 3370